Build tornado and spider charts
The Sensitivity Viewer is a tool which allows you to build tornado and spider charts to see the impact of changes in input values on result variables. To open it, click on  on the Palantir tab on the ribbon. For information about screen elements, see Sensitivity Viewer. To build the charts:
- Select the partner and project scenario you want to analyze.
- Select the variable on which you want to see the impact from the list in the Variable field. If the variable is not on the list, click on the Add button, select the variable in the pop-up window and click OK. To remove a variable from the list, select it and click on the Remove button.
- Select the currency, currency scenario and unit scale to be used for analysis in the corresponding fields.
- To apply a discount rate which is different from rates specified in the associated Calculation Parameters document, enter it in the Adhoc Discount Rates field. You can specify several rates byseparating them with a comma.
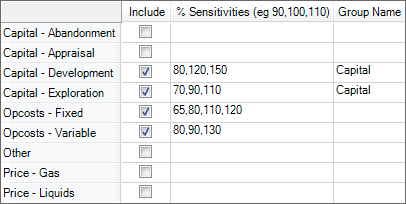
- The pane on the right shows variable categories whose impact on the selected variable will be analyzed. This list includes all variable categories available in the project; categories are specified when variables are created (see Variable Definitions). Select the categories by checking boxes in the Include column.
- Specify sensitivities in the % Sensitivities field. You can set up as many sensitivities as you need, separating them with commas; for example, 90,100,120 means 90%, 100% and 120% of the original value.
- You can combine variable categories into groups by typing names in the Group Name column. For example, if you have the Capex-Development and Capex-Exploration categories and want to see the total capex, type Capex in the Group Name cells in the corresponding rows.

- Click on the Calculate button, and the progress bar will be displayed. After calculations have been finished, the charts will be displayed.
- You can edit and save the chart by using its context menu; right-click to open it.
- If you are going to build the same chart again, use the Save Template link to save the current settings as a template.